Seeing what’s beneath the surface
SpaceTech AI’s research runs in two streams: autonomous drone-swarm inspection of launch vehicles and pads, and AI-driven defect detection inside the composite structures themselves. What follows is a deeper look at the composite-defect work — a software proof-of-concept from the founder’s UC Berkeley graduate research — and, just as importantly, how honestly it was tested.
Composites are flight-critical — and their defects are invisible
Flight-critical
Carbon-fiber composite (CFRP) laminates carry primary loads in modern launch vehicles — airframes, interstages, bulkheads, pressure vessels — at a fraction of the weight of aluminum.
Often invisible
The failures that matter — delamination, porosity, inclusions, impact damage — frequently leave no mark on the surface. They have to be found beneath it.
The evidence gap
Deep-learning thermography promises fast, contactless inspection — but a headline accuracy number can measure far less than it appears to. Knowing the difference is the whole game.
Infrared thermography, read by a neural network
A short, intense heat pulse is applied to a laminate’s surface; a mid-wave infrared (MWIR) camera then watches how heat flows through the material over time. Subsurface defects disturb that flow, leaving faint thermal signatures.
A U-Net segmentation model, built in PyTorch, learns to read those signatures and outline where defects lie — turning a sequence of thermal frames into a defect map. It is an early proof-of-concept (TRL 2–3), trained and validated in software on a public benchmark dataset, not a fielded system.
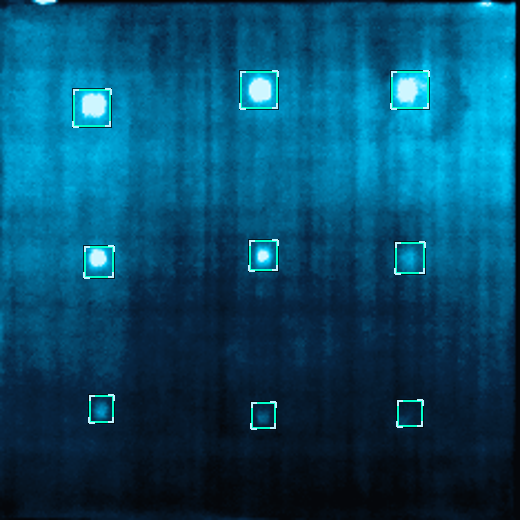
Benchmark data: Thermal Inspection Dataset for Defect Segmentation in CFRP Laminates — Carbon/PEEK laminate, artificial Kapton-insert defects, pulsed thermography, mid-wave infrared. Public dataset (Mendeley Data). The proof-of-concept was trained and evaluated entirely on this open benchmark.
The same model, measured honestly
The research’s real contribution isn’t a score — it’s a method for finding out when a score is lying to you. A model that looks near-perfect on an easy test can fall off sharply the moment the test reflects deployment reality.
Why the drop? Two failure modes a single headline number hides:
- Temporal leakage. Thermal frames a fraction of a second apart are nearly identical — so a random shuffle lets the model effectively study the answers before the test.
- Spatial memorization. Trained on one specimen, a model can learn where defects sit rather than what a defect looks like — and that knowledge doesn’t transfer to a new part.
A battery of diagnostics, each exposing a different illusion
Temporal cross-validation
Split frames chronologically instead of randomly, so the model is judged on moments it never saw.
Contiguous-block split
Hold out whole time-blocks as the honest floor — eliminating the near-duplicate-frame shortcut entirely.
Copy-paste spatial probe
Relocate known defects to novel positions to test whether the model learned physics or memorized coordinates.
Multi-seed stability
Repeat training across random seeds to separate genuine skill from lucky initialization.
Clean-frame false-positive audit
Score defect-free frames on their own, so the false-alarm rate can’t hide behind overall accuracy.
Resolution ablation
Vary working resolution to see whether it changes what the model can and cannot detect.
Better data, not better models
For researchers
Random shuffles overstate how well a model generalizes in time. A chronological or block split should be the floor, with a spatial-transfer probe run before any headline number is reported.
For the next benchmark
Multi-specimen data is the binding constraint for any deployment claim — and defect positions must vary, or the spatial shortcut quietly returns.
For deployment-grade NDE
A path to certifiable composite inspection runs through more demanding diagnostics layered over better datasets — the discipline SpaceTech AI builds in from the start.
Why 10–20 drones — the modeled trade-space
Our flagship research models autonomous drone-swarm inspection of launch vehicles and pads with a Python Monte Carlo simulation (1–100 drones, a million iterations per swarm size) — from the founder’s 2024 von Braun Space Exploration Symposium work at UC Berkeley.
The finding isn’t “more drones.” Inspection time, cost, and personnel exposure drop steeply as a small swarm coordinates — then flatten. Past roughly 20 drones you add fleet cost and coordination loss for little further gain, so 10–20 coordinated drones is the modeled operating window. The headline figures and caveats live on the home page.
What the simulation varied: manual-baseline team size, hourly rates, inspection duration, training, and insurance; the drone-swarm team’s labor, inspection time, base costs, advanced sensors, and maintenance; and operational friction — battery life, weather delay, safety factors, and coordination losses as swarm size grew. Model verification & validation, sensitivity analysis, and field calibration remain future work.